Day Trading could be as complex (and frustrating) as you think it could be. Isn’t it true that in most situations in Life, obstacles seem insurmountable until you learn how to overcome them through experience and knowledge? Well, from my experience Day Trading can be as simple as you make it. It is up to you to set your own guidelines and strategies based on your experiences. Seriously, there are no fast rules or secrets, and why would these so-called gurus want to real you into their ‘classes’, if they can easily make money just day trading and not have to spend all this time and energy teaching others? Well, because they can make a LOT of money teaching you something you could probably figure out on your own. And if it’s so difficult then you are probably better off doing something else. Day Trading is not for everyone.
The Basic Scenario

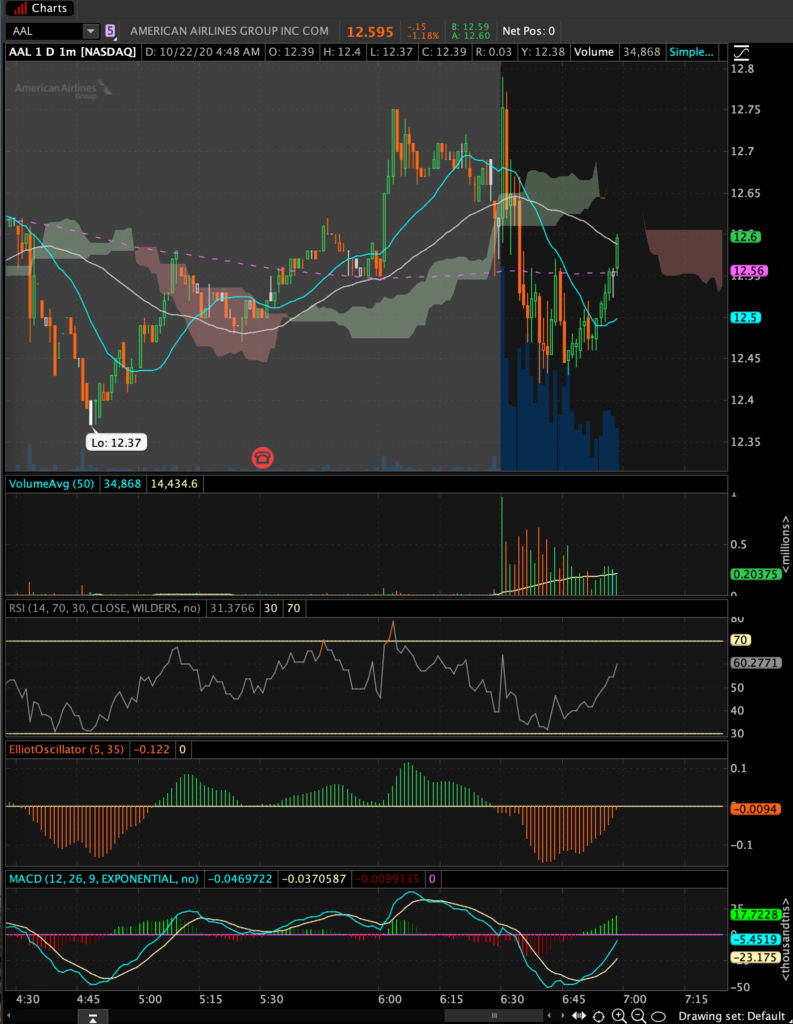
The chart above shows American Airlines (AAL) within the first hour of the trading session. Right off the bat, the stock open strong but then quickly plummeted and then began to rebound. In essence, this scenario is what I look for when day trading. And trading right away in the first 5 minutes could reap big gains, but they can also create big losses. Why? It’s because when the stock market first opens, there is really no point-of-reference to gauge for an entry point. And the pre-market trading doesn’t really tell you anything. Once the markets actually open, it could be far different than pre-market. So, when the markets open I wait first for the stock to tank, then it’s easier to gauge the entry point because the indicators will begin to show a rebound at some point in time. It could be within the first half hour, it could be longer. Don’t move until you see it.
What Are We Looking For?
Personally, I look at the ElliottOscillator first and look for it to be deep in the red (or orange in my chart). And look for it getting back up to zero. At the same time I look at the MACD (below ElliottOscillator) to show a rebound there as well. See how strong that looks?
The lower indicator just below the chart is the VolumeAvg, and I see that there are some green bars there, a good sign because traders are buying the stock and causing it to rise.
Below the VolumeAvg is the RSI (Relative Strength Index) and I see that it had fallen close to 30, which means the stock was oversold, and RSI is rising quickly towards 70 which means the stock is overbought. RSI at around 30 is a good indicator for an entry point, but movement towards 70 is definitely a good time to buy.
The Exit Point?
Let’s face it. Exit Strategy could be harder to determine, yet not so difficult to understand. Basically, you want to buy enough shares that if you reach your profit amount, you can exit with at least $100 dollars. I won’t go into the math because most people can figure it out. I have a chart below that really helps me out when determining exit points.

To Summarize
And that’s my basic day trading strategy, which I think should be kept as simple as possible. But only through experience can one get from making $100 a trade versus making $500 or more.
If you keep the strategy simple you will get good at doing the one thing, and in time it will become routine once you find the stocks that will work for you.
And this strategy might now work for you, yet it works for me. Everyone is going to approach day trading differently, but it’s vital that you exercise caution when implementing a new strategy, and it’s best to practice it in your trading platform’s paper trading section, so you don’t lose money.
Note: The stock market is prone to volatile price swings. Trade at your own risk.


Related Posts